top of page
DataViz x PFPCA

DataViz is changing the way NFL teams use their data. From AI to automated reporting and large data correlations, we step outside the traditional AMS box and empowering coaches to redefine sports science
Roderick Moore, Asst S&C/Sports Science Coordinator for the Pittsburgh Steelers shares how DataViz has been invaluable to them!
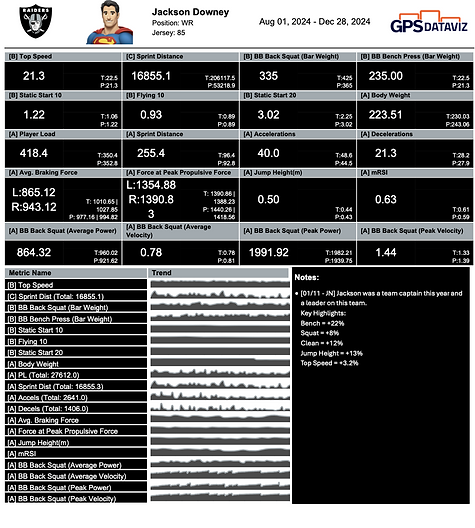
Sample GPS Report


DataViz AI
AI is reshaping our world. Now, users
have the ability to talk to your data.
So whether you or coach have a question about your data, you have answers in seconds not hours.


Predictive Analytics
Much of the data we collect tells us what has already happened, we want to help educate what is going to happen. With predictive analytics you can build your proactive plan and we will predict the loads for your team and individual players!
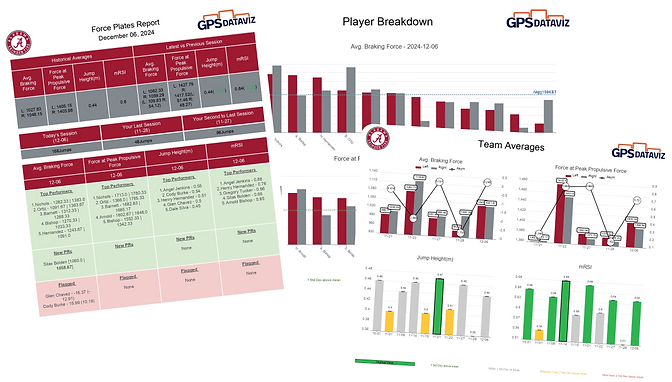
Foce Plates, VBT, Nordbord, 1080, Timing Gates & 350+ more!
Force Plate & Testing companies provide thousands of data points that are nearly impossible to measure. With our automated reporting coaches get insights for the team & individuals about their Force Plate and Testing data to correlate with their GPS data.
.png)
Individual Reports + Report Cards


Automated Weekly Report


Scatterplot
Build correlations by creating your own scatterplot across any data point that plot data for every player, over any time frame, associated by Game Day.
ACWR
Acute to Chronic Workload Ratio: (ACWR) This ratio compares a player’s acute load (last 7 days) to their chronic load (21 days prior). The calculation takes the average load over the last 7 days divided by the average load over the 21 days before that. The sweet spot for the ratio is between 0.8 and 1.3.

bottom of page